SMART VSA Long Term (Weekly) Long USD Demo Test
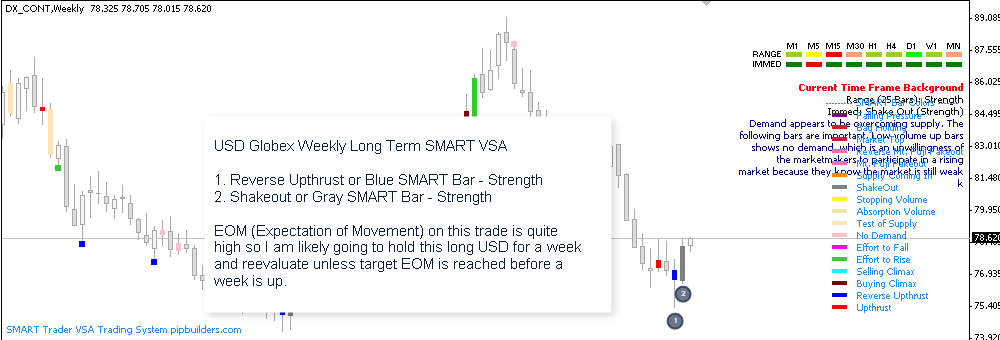
The following setup is a bit late (the reverse upthrust is one of my favorite VSA signals) but we do have some excellent examples of standard volume spread analysis signals (the Reverse Upthrust and a the Shakeout). If you are using SMART they appear as a SMART Blue Bar and a SMART Gray Bar (Illustrated in the example chart below).
The EOM (Expectation of Movement) on this trade should be quite high but I will monitor the trade throughout the week on shorter time frames and exit if things change or the target EOM is hit. If it is not exited prior to the next candle start I will reevaluate on the current time-frame (weekly)
Here is the chart. I will update as the week progresses.
Note: This is a test on demo as this is a weekly chart (I normally trade the hourly) so do not follow this trade. I did not mention this in the chat either for that reason.
Screenshot:
Please keep in mind SMART Trader itself is painting these bars which makes these patterns and setups much easier to spot and act on.
These patterns repeat themselves day in and day out and using SMART you can clearly see not only standard VSA signals but our advanced multibar SMART VSA patterns as well.
Trade setups are verified using our proprietary background scanners (included with the system).
For more information or if you have any questions about SMART Trader Volume Spread Analysis (VSA) Software please visit
SMART Trader at pipbuilders.com or visit our Live and Free VSA (Volume Spread Analysis) Chat and Trading Room at http://vsa.pipbuilders.com
Good luck trading and see you in the chat.
